Friday 31 August 2018

Happy Merdeka Day - Ini Kita Punya!

This is my country....Malaysia and I'm proud to be Malaysian.

Thank you to my students for accepting the challenge and completed this assignment. Of course, the of the main reason of doing this is inculcate the sense of patriotism among you. This is Malaysia, your country, we owned it. This is why I urging you to celebrate the Merdeka Day. I also asked them to contribute something for me to upload in conjunction of this special day.

Well done boys and girls!!!


Wednesday 29 August 2018

MFRS101 Presentation of Financial Statements

MFRS101 Presentation of Financial Statements

Students' presentation. Well done!


Presented by Muhamad Ashraf Norsyafudin

Monday 27 August 2018

Systematic Risk - Cost of capital

Systematic Risk, Unsystematic Risk, Probability, and Expected Value

There are many types of investing risk. I believe the ultimate risk is permanently losing your capital. In order to avoid the ultimate risk you need an investment risk management plan. Part of this plan is to understand systematic and unsystematic risk and the most effective approaches to mitigating these risks.
Systematic and Unsystematic Risk

Systematic Risk

Systematic risk is risk associated with market returns. This is risk that can be attributed to broad factors. It is risk to your investment portfolio that cannot be attributed to the specific risk of individual investments.
Sources of systematic risk could be macroeconomic factors such as inflation, changes in interest rates, fluctuations in currencies, recessions, wars, etc. Macro factors which influence the direction and volatility of the entire market would be systematic risk. An individual company cannot control systematic risk.
Systematic risk can be partially mitigated by asset allocation. Owning different asset classes with low correlation can smooth portfolio volatility because asset classes react differently to macroeconomic factors. When some asset categories  (i.e. domestic equities, international stocks, bonds, cash, etc.) are increasing others may be falling and vice versa.
To further reduce risk, asset allocation investment decisions should be based on valuationI want to adjust my asset allocation target according to valuations.  I want to overweight those asset classes that are bargains and own less or avoid investments which are overpriced. When mitigating systematic risk within a diversified portfolio, cash may be the most important and under appreciated asset category.

Unsystematic Risk

Unsystematic risk is company specific or industry specific risk. This is risk attributable or specific to the individual investment or small group of investments. It is uncorrelated with stock market returns. Other names used to describe unsystematic risk are specific risk, diversifiable risk, idiosyncratic risk, and residual risk.
Examples of risk that might be specific to individual companies or industries are business risk, financing risk, credit risk, product risk, legal risk, liquidity risk, political risk, operational risk, etc. Unsystematic risks are considered governable by the company or industry.
Proper diversification can nearly eliminate unsystematic risk1. If an investor owns just one stock or bond and something negative happens to that company the investor suffers great harm. But if an investor owns a diversified portfolio of 20, 30, or 40 individual investments, the damage done to the portfolio is minimized.
The important concept of unsystematic risk is that it is not correlated to market risk and can be nearly eliminated by diversification.

Probability and Expected Value

The expected value or return of a portfolio is the sum of all the possible returns multiplied by the probability of each possible return. One form of risk is the amount of deviation and the probability of that deviation from the expected return.
Portfolio risk is reduced by mitigating systematic risk with asset allocation, and unsystematic risk with diversification. Mitigation of systematic and unsystematic risk allows a portfolio manager to put higher risk/reward assets in the portfolio without accepting additional risk. This is called portfolio optimization.
In other words, a manager is willing to accept a given amount of risk. The total risk of the portfolio is  lowered through proper asset allocation and diversification. Now the the manager can add more aggressive investments to the portfolio and still maintain the given amount of risk he is willing to accept.

Conclusion

Systematic and unsystematic risks can be partially mitigated with risk management solutions such as asset allocation, diversification, and valuation timing. Used properly, a manager can increase portfolio returns and/or reduce risk to optimize an investment portfolio.

Thursday 23 August 2018

Assignment - ACC1231 and BUS1233

Assalamualaikum and dear students,

At last, the assignment that you are waiting for is here! Well, I guess you are anxious to do it, I bet you are!

So, get into a group of minimum 2 to a maximum 4 person per group. Submission date will be 8 October 2018 by 5pm. You may trash it if you submit later than the required date.

Good luck!

Press this link for the question....

The Assignment


Thursday 16 August 2018

Variable and Absorption Costing

JUST KEEP ON STUDYING ACC2236

A group of anti-social formed a company producing a product called “Deaf & Ego”. The product has a selling price of RM60 per unit. The information of the product is as below;


RM
Direct material
-      Mute
-      Snub
-      Selfish

3kg@RM1.20/kg
2kg@RM0.80/kg
1kg@RM4.60/kg
Direct labour
-      Skilled
-      Semi-skilled

RM5/hour
RM3/hour
Direct expenses
RM2/unit
Variable selling and administration overheads
RM3/unit
Fixed production overhead
30,000
Fixed selling and administration overheads
15,000


Units
Units produced
32,000
Budgeted production units
40,000
Units sold
28,000

The product took 2 hours to produce by the skilled labour and 2.5 hours by the semi-skilled labour. The marketing department had spent RM25,000 to promote the product but the staff wouldn’t care less about the product.


Required:
  1.      Prepare the income statement under the variable costing and absorption costing system for the four periods ending December 2018.
  2.      What is the Break-even point in units for the above product.

Wednesday 15 August 2018

Open for bookings.....

Some may need this and some may not... 

Slot available for grab Monday to Thursday 8.00pm to 11.00pm (Grab service is provided for late session)
Weekend slot will be based on demand and depends on the tutor's schedule.
Hurry before the slots are taken!

Yippi me to book your slot!

Click this link to download YIPPI
Add me as your friend: fm04


p/s: Play Duckwanted in yippi. You may won prizes!

Thursday 9 August 2018

Cost Accumulation and Cost Assignment - Product Cost

Try this for an exercise!

Baked by AS having its operation in Seri Gombak is currently producing various delicacies for hotels and resort for Klang Valley and its sorroundings. During the month of August 2018, the company purchased RM160,000 of raw materials consist of flour, whipped cream and cheese. Direct labour hours worked during the period were 10,000 hours and the workers were paid at the rate of RM8 per hour. The company also incurred direct expenses such as baking soda, fat etc for a total of RM64,000. The production overheads for the month were RM88,000.

The selling price for a batch 10 boxes of Pavlova was RM6,000. The company also incurred a selling cost of RM96,000 which includes sales commission and facebook advertisements. The administration cost for the month was RM30,000.

Below are the relevant information regarding the production of Pavlova for the month;

                                                      1 August 2018                31 August 2018
Raw materials stock                            RM26,000                     RM48,000
Work-in-progress stock                        RM45,000                     RM22,000
Finished goods stock                           RM12,800                     RM27,500


Required:
  1. Determine the cost of raw materials consumed in production and the prime costs.
  2. Calculate the cost of goods sold manufactured for the month of August 2018.
  3. Calculate the cost of one batch of Pavlova, assuming 60 batches were completed during August 2018.
  4. Prepare a cost of goods sold statement for the month of August 2018.
  5. Determine the number of batches sold in the month of August 2018.
  6. Prepare an income statement for the month of March 2018.

See you in class!

Cost-Volume-Profit Analysis - Exercise

Show time!

A Malaysian novelist with a pen name Kepalakubuntu is producing series of novels namely Aku, Kau, Dia, Kita dan Mereka. Each of these novels have their own cost and Kepalakubuntu is now thinking and planning to sell these in the next 2 months. The costs are as below;

                                                       Aku           Kau            Dia            Kita           Mereka
Direct material - paper                       4                3                5                4                   6
Direct material - rock                         2                2                3                2                   4
Direct material - scissors                    5                -                 4                5                   3
Direct expenses                                 4                 5                3                3                   3


Each novels require 2 hours to produce with the total labour cost of RM4.50 per hour.

Currently, Kepalakubuntu had to pay for the rental of the factory for RM8,000 and will increase by 20% in three months time. He also had to bear the salary for his 3 lazy fulltime workers whose salaries are RM3,000, RM4,000 and RM3,500 respectively.

He planned to put the selling price of the novels as below;

Novels       Price                  Projected sales
Aku         RM40/unit             15,000 units
Kau         RM28/unit             10,000 units
Dia          RM35/unit             20,000 units
Kita         RM27/unit             12,000 units
Mereka    RM36/unit             23,000 units


Required;
  1. Calculate the BEP in units for each of the above novels.
  2. Calculate the BEP in RM for each of the above novels.
  3. If Kepalakubuntu wants to obtain additional profit of RM20,000, how many units he has to sell?
  4. An increase of 10% for the direct material - paper and labour rate may lead to an increase in the selling price of another 5% for each novels. In order to minimze such costing, Kepalakubuntu is also planning to sack one of his worker whose earning the highest salary. Still obtaining his targeted profit of RM20,000, what will be his new BEP units after all off the above were taken into accounts.


Wednesday 8 August 2018

Cost-Volume-Profit Analysis - formula (Multiple product)

CVP formula with multi product


Previously, I have illustrated the BEP for a single product. This time around, I will show you how to calculate the BEP for a multi product company. A multi-product company means a company that sells two or more products.

The procedure of computing break-even point of a multi product company is a little more complicated than that of a single product company. Well, what to do.... this is what you agreed to study.....hahahaha!


It is late now....going to sleep. I took these from a web.

https://www.accountingformanagement.org/break-even-analysis-with-multiple-products/

Formula:

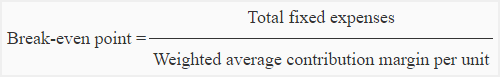
A multi product company can compute its break-even point using the following formula:
break-even-analysis-with-multiple-products-img1
For computing break-even point of a company with two or more products, we must know the sales percentage of individual products in the total sales mix. This information is used in computing weighted average selling price and weighted average variable expenses.
In the above formula, the weighted average selling price is worked out as follows:
(Sale price of product A × Sales percentage of product A) + (Sale price of product B × Sale percentage of product B) + (Sale price of product C × Sales percentage of product C) + …….
and the weighted average variable expenses are worked out as follows:
(Variable expenses of product A × Sales percentage of product A) + (Variable expenses of product B × Variable expenses of product B) + (Variable expenses of product C × Sales percentage of product C) + …….
When weighted average variable expenses per unit are subtracted from the weighted average selling price per unit, we get weighted average contribution margin per unit. Therefore, the above formula can also be written as follows:
break-even-analysis-with-multiple-products-img2
An example would be very helpful to understand the whole procedure. Consider the following example of a multi product company:


Example:

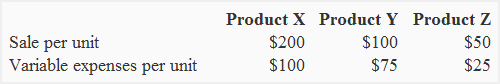
The Monster company manufactures three products – product X, product Y and product Z. The variable expenses and sales prices of all the products are given below:
break-even-analysis-with-multiple-products-img3
The total fixed expenses of the company are $50,000 per month. For the coming moth. Monster expects the sale of three products in the following ratio:
Product X: 20%;
Product Y: 30%;
Product Z: 50%
Required: Compute the break-even point of Monster company in units and dollars for the coming month.

Solution:

Monster company sells three products and is, therefore, a multi product company. Its break-even point can be computed by applying the above formula:
break-even-analysis-with-multiple-products-img1
= $50,000 / $95* – $55**= $50,000 / $40
= 1,250 units
*Weighted average selling price:
= ($200 × 20%) + ($100 × 30%) + ($50 × 50%)
= $40 + $30 + $25
= $95
**Weighted average variable expenses:
= ($100 × 20%) + ($75 × 30%) + ($25 × 50%)
= $20 + 22.50 + 12.50
= $55
The company will have to sell 1,250 units to break-even. Now I would compute the number of units of each product to be sold:
Product X (1,250 × 20%): 250 units
Product Y (1,250 × 30%): 375 units
Product Z (1,250 × 50%): 625 units
Total:250 units + 375 units + 625 units = 1,250 units
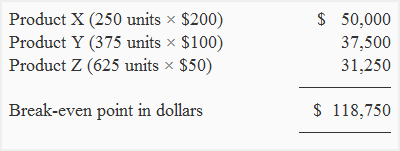
As the number of units of each individual product to be sold have been computed, I can compute the break even point in dollars as follows:
break-even-analysis-with-multiple-products-img4
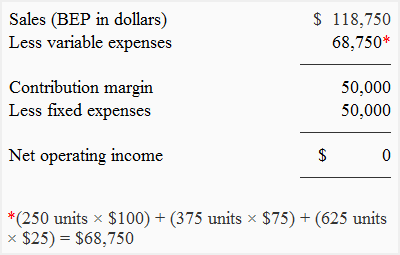
The break-even point of Monster company is $118,750. It can be verified by preparing a contribution margin income statement as follows:
break-even-analysis-with-multiple-products-img5

Cost-Volume-Profit Analysis - formula

CVP formula

The BEP can be obtained either in units or in RM. Therefore it is important to know the relevant information needed to calculate using the the given formula;

To find how many units to produce to break-even,

BEP(units) = Fixed Cost/Contribution Margin

To find the break-even in Ringgit,

BEP(RM) = Fixed Cost/Contribution Margin %

Sometimes, we put a figure to target certain profit, the BEP in units,

BEP(units) = (Fixed Cost + Targeted Profit)/Contribution Margin

Same goes to the targeted profit, the BEP in Ringgit,

BEP(RM) = (Fixed Cost + Targeted Profit)/Contribution Margin %

Example 1

Below are the cost to manufacture product XYZ in period 1

Direct material      RM       6
Direct labour                    3
Direct expenses                2
Rental                        5,000
Salary                       12,000

Selling price           RM    20

Solution;

Total Variable cost per unit (RM) = DM + DL + DE
                                                 = 6 + 3 + 2
                                                 = 11

Total fixed cost (RM)                  = Rental + Salary
                                                 = 5,000 + 12,000
                                                 = 17,000

Contribution margin (RM)            = Selling price - Variable cost
                                                 = 20 - 11
                                                 = 9

Contribution margin(%)               = CM/Selling price
                                                 = 9/20
                                                 = 45%

Using the formula;

BEP(units) = Fixed Cost/Contribution Margin

                  = 17,000/9
                  = 1,889 units


BEP(RM) = Fixed Cost/Contribution Margin %

                = 17,000/45%
                = RM37,778 


Example 2

If the management wants an additional profit (targeted profit) then,

Targeted profit (RM)        = RM10,000

BEP(units) = (Fixed Cost + Targeted Profit)/Contribution Margin

                  = (17,000 + 10,000)/9
                  = 3,000 units


BEP(RM) = (Fixed Cost + Targeted Profit)/Contribution Margin %

                = (17,000 + 10,000/45%
                = RM60,000 


However, the above formula can only be applied for a single product.

If there are changes in the selling price, variable cost and fixed cost, the formula can be adjusted accordingly. 

But.....in order to get this formula works for you, all of the above should remain constant at the time you are doing the calculation. All must be constant.