Showing posts with label Cost of capital. Show all posts

Monday, 27 August 2018

Systematic Risk - Cost of capital

Systematic Risk, Unsystematic Risk, Probability, and Expected Value

There are many types of investing risk. I believe the ultimate risk is permanently losing your capital. In order to avoid the ultimate risk you need an investment risk management plan. Part of this plan is to understand systematic and unsystematic risk and the most effective approaches to mitigating these risks.
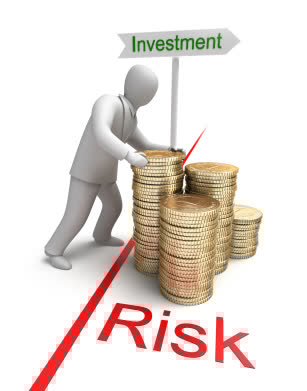
Systematic and Unsystematic Risk

Systematic Risk

Systematic risk is risk associated with market returns. This is risk that can be attributed to broad factors. It is risk to your investment portfolio that cannot be attributed to the specific risk of individual investments.
Sources of systematic risk could be macroeconomic factors such as inflation, changes in interest rates, fluctuations in currencies, recessions, wars, etc. Macro factors which influence the direction and volatility of the entire market would be systematic risk. An individual company cannot control systematic risk.
Systematic risk can be partially mitigated by asset allocation. Owning different asset classes with low correlation can smooth portfolio volatility because asset classes react differently to macroeconomic factors. When some asset categories  (i.e. domestic equities, international stocks, bonds, cash, etc.) are increasing others may be falling and vice versa.
To further reduce risk, asset allocation investment decisions should be based on valuationI want to adjust my asset allocation target according to valuations.  I want to overweight those asset classes that are bargains and own less or avoid investments which are overpriced. When mitigating systematic risk within a diversified portfolio, cash may be the most important and under appreciated asset category.

Unsystematic Risk

Unsystematic risk is company specific or industry specific risk. This is risk attributable or specific to the individual investment or small group of investments. It is uncorrelated with stock market returns. Other names used to describe unsystematic risk are specific risk, diversifiable risk, idiosyncratic risk, and residual risk.
Examples of risk that might be specific to individual companies or industries are business risk, financing risk, credit risk, product risk, legal risk, liquidity risk, political risk, operational risk, etc. Unsystematic risks are considered governable by the company or industry.
Proper diversification can nearly eliminate unsystematic risk1. If an investor owns just one stock or bond and something negative happens to that company the investor suffers great harm. But if an investor owns a diversified portfolio of 20, 30, or 40 individual investments, the damage done to the portfolio is minimized.
The important concept of unsystematic risk is that it is not correlated to market risk and can be nearly eliminated by diversification.

Probability and Expected Value

The expected value or return of a portfolio is the sum of all the possible returns multiplied by the probability of each possible return. One form of risk is the amount of deviation and the probability of that deviation from the expected return.
Portfolio risk is reduced by mitigating systematic risk with asset allocation, and unsystematic risk with diversification. Mitigation of systematic and unsystematic risk allows a portfolio manager to put higher risk/reward assets in the portfolio without accepting additional risk. This is called portfolio optimization.
In other words, a manager is willing to accept a given amount of risk. The total risk of the portfolio is  lowered through proper asset allocation and diversification. Now the the manager can add more aggressive investments to the portfolio and still maintain the given amount of risk he is willing to accept.

Conclusion

Systematic and unsystematic risks can be partially mitigated with risk management solutions such as asset allocation, diversification, and valuation timing. Used properly, a manager can increase portfolio returns and/or reduce risk to optimize an investment portfolio.


Sunday, 10 September 2017

BUACC3701 - Cost of Capital (cont')

Capital structure is a mix of a company's long-term debt, specific short-term debt, common equity and preferred equity. The capital structure represents how a firm finances its overall operations and growth by using different sources of funds.

Debt comes in the form of bond issues or long-term notes payable, while equity is classified as common stock, preferred stock or retained earnings. Short-term debt such as working capital requirements is also considered to be part of the capital structure.

A company's proportion of short and long-term debt is considered when analyzing capital structure. When people refer to capital structure they are most likely referring to a firm's debt-to-equity ratio, which provides insight into how risky a company is. Usually a company more heavily financed by debt poses greater risk, as this firm is relatively highly levered.

Optimal capital structure is the best debt-to-equity ratio for a firm that maximizes its value and minimizes the firm's cost of capital. In theory, debt financing generally offers the lowest cost of capital due to its tax deductibility. However, it is rarely the optimal structure since a company's risk generally increases as debt increases. A healthy proportion of equity capital, as opposed to debt capital, in a company's capital structure is an indication of financial fitness. We'll discuss optimal capital structure further in section 14.


Controllable Factors Affecting Cost of Capital

These are the factors affecting cost of capital that the company has control over:


  • Capital Structure Policy
    A firm has control over its capital structure, and it targets an optimal capital structure. As more debt is issued, the cost of debt increases, and as more equity is issued, the cost of equity increases.
  • Dividend Policy
    Given that the firm has control over its payout ratio, the breakpoint of the marginal cost of capital schedule can be changed. For example, as the payout ratio of the company increases, the breakpoint between lower-cost internally generated equity and newly issued equity is lowered. (Read How And Why Do Companies Pay Dividends? and Due Diligence On Dividends to learn more.)
  • Investment Policy
    It is assumed that, when making investment decisions, the company is making investments with similar degrees of risk. If a company changes its investment policy relative to its risk, both the cost of debt and cost of equity change.
Uncontrollable Factors Affecting the Cost of Capital

These are the factors affecting cost of capital that the company has no control over:
  • Level of Interest Rates
    The level of interest rates will affect the cost of debt and, potentially, the cost of equity. For example, when interest rates increase the cost of debt increases, which increases the cost of capital.

Tax Rates
Tax rates affect the after-tax cost of debt. As tax rates increase, the cost of debt decreases, decreasing the cost of capital.

The cost of equity is the return that stockholders require for their investment in a company. The traditional formula for cost of equity (COE) is the dividend capitalization model:


A firm's cost of equity represents the compensation that the market demands in exchange for owning the asset and bearing the risk of ownership. (Learn more about investing in Hate Dealing With Money? Invest Without Stress and Investment Options For Any Income.)

Here's a very simple example: let's say you require a rate of return of 10% on an investment in TSJ Sports. The stock is currently trading at $10 and will pay a dividend of $0.30. Through a combination of dividends and share appreciation you require a $1.00 return on your $10.00 investment. Therefore the stock will have to appreciate by $0.70, which, combined with the $0.30 from dividends, gives you your 10% cost of equity.

A company that earns a return on equity in excess of its cost of equity capital has added value. (For more on ROE, read Keep Your Eyes On The ROE.)


Calculating the Cost of Equity

The cost of equity can be a bit tricky to calculate as share capital carries no "explicit" cost. Unlike debt, which the company must pay in the form of predetermined interest, equity does not have a concrete price that the company must pay, but that doesn't mean no cost of equity exists.


Common shareholders expect to obtain a certain return on their equity investment in a company. The equity holders' required rate of return is a cost from the company's perspective because if the company does not deliver this expected return, shareholders will simply sell their shares, causing the price to drop. The cost of equity is basically what it costs the company to maintain a share price that is theoretically satisfactory to investors. (For further reading on share price, see Top 5 Stocks Back From The Dead and The Highest Priced Stocks In America.)

On this basis, the most commonly accepted method for calculating cost of equity comes from the Nobel Prize-winning capital asset pricing model (CAPM): The cost of equity is expressed formulaically below:

Re = rf + (rm – rf) * β
Where:
  • Re = the required rate of return on equity
  • r= the risk free rate
  • rm – r= the market risk premium
  • β = beta coefficient = unsystematic risk

But what does this mean?

  • Rf – Risk-free rate - This is the amount obtained from investing in securities considered free from credit risk, such as government bonds from developed countries. The interest rate of U.S. Treasury Bills is frequently used as a proxy for the risk-free rate.
  • ß – Beta - This measures how much a company's share price reacts against the market as a whole. A beta of one, for instance, indicates that the company moves in line with the market. If the beta is in excess of one, the share is exaggerating the market's movements; less than one means the share is more stable. Occasionally, a company may have a negative beta (e.g. a gold-mining company), which means the share price moves in the opposite direction to the broader market. (Learn more in Beta: Know The Risk.)
    For public companies, you can find database services that publish betas. Few services do a better job of estimating betas than BARRA. While you might not be able to afford to subscribe to the beta estimation service, this site describes the process by which they come up with "fundamental" betas. Bloomberg and Ibbotson are other valuable sources of industry betas.
  • (Rm – Rf) = Equity Market Risk Premium (EMRP) - The equity market risk premium (EMRP) represents the returns investors expect to compensate them for taking extra risk by investing in the stock market over and above the risk-free rate. In other words, it is the difference between the risk-free rate and the market rate. It is a highly contentious figure. Many commentators argue that it has gone up due to the notion that holding shares has become more risky.
    The EMRP frequently cited is based on the historical average annual excess return obtained from investing in the stock market above the risk-free rate. The average may either be calculated using an arithmetic mean or a geometric mean. The geometric mean provides an annually compounded rate of excess return and will in most cases be lower than the arithmetic mean. Both methods are popular, but the arithmetic average has gained widespread acceptance.

Once the cost of equity is calculated, adjustments can be made to take account of risk factors specific to the company, which may increase or decrease a company's risk profile. Such factors include the size of the company, pending lawsuits, concentration of customer base and dependence on key employees. Adjustments are entirely a matter of investor judgment, and they vary from company to company. (Learn more in The Capital Asset Pricing Model: An Overview.)


Cost of Newly Issued Stock

Cost of newly issued stock (Rc) is the cost of external equity, and it is based on the cost of retained earnings increased for flotation costs (cost of issuing common stock). For a constant-growth company, this can be calculated as follows:


Rc = D1__ + g
P0 (1-F)

 where:
F = the percentage flotation cost, or (current stock price - funds going to company) / current stock price

Example: Cost of Newly Issued Stock
Assume Newco's stock is selling for $40, its expected ROE is 10%, next year's dividend is $2 and the company expects to pay out 30% of its earnings. Additionally, assume the company has a flotation cost of 5%. What is Newco's cost of new equity?


Answer: 
Rc = + 0.07 = 0.123, or 12.3%
40(1-0.05)


It is important to note that the cost of newly issued stock is higher than the company's cost of retained earnings. This is due to the flotation costs. (For more on newly issued stock, see Why Investors Can't Get Enough Of Social Media IPOs and 5 Signs That Social Media Is The Next Bubble.)

Weighted Average Cost of Equity

Weighted average cost of equity (WACE) is a way to calculate the cost of a company's equity that gives different weight to different aspects of the equities. Instead of lumping retained earnings, common stock and preferred stock together, WACE provides a more accurate idea of a company's total cost of equity.

Here is an example of how to calculate WACE:

First, calculate the cost of new common stock, the cost of preferred stock and the cost of retained earnings. Let's assume we have already done this and the cost of common stock, preferred stock and retained earnings are 24%, 10% and 20% respectively.

Now, calculate the portion of total equity that is occupied by each form of equity. Again, let's assume this is 50%, 25% and 25%, for common stock, preferred stock and retained earnings, respectively.

Finally, multiply the cost of each form of equity by its respective portion of total equity, and sum of the values to get WACE. Our example results in a WACE of 19.5%.
WACE = (.24*.50) + (.10*.25) + (.20*.25) = 0.195 or 19.5%

Determining an accurate cost of equity for a firm is integral in order to be able to calculate the firm's cost of capital. In turn, an accurate measure of the cost of capital is essential when a firm is trying to decide if a future project will be profitable or not.

Recall from Section 5 that companies sometimes finance their operations through debt in the form of bonds because bonds provide more flexible borrowing terms than banks. How much do companies pay for this debt?

Compared to cost of equity, cost of debt is fairly straightforward to calculate. The rate applied to determine the cost of debt (Rd) should be the current market rate the company is paying on its debt. If the company is not paying market rates, an appropriate market rate payable by the company should be estimated.


Calculating the Cost of Debt

Because companies benefit from the tax deductions available on interest paid, the net cost of the debt is actually the interest paid less the tax savings resulting from the tax-deductible interest payment.

The after-tax cost of debt can be calculated as follows:


After-tax cost of debt = R(1-tc)
Note: Rd represents the cost to issue new debt, not the cost of the firm\'s existing debt. 

Example: Cost of Debt
Newco plans to issue debt at a 7% interest rate. Newco's total (both federal and state) tax rate is 40%. What is Newco's cost of debt?

Answer:
Rd (1-tc) = 7% (1-0.40) = 4.2%


Calculating the Cost of Preferred Stock

As we discussed in section 6 of this walkthrough, preferred stocks straddle the line between stocks and bonds. Technically, they are equity securities, but they share many characteristics with debt instruments. Preferreds are issued with a fixed par value and pay dividends based on a percentage of that par at a fixed rate.


Cost of preferred stock (Rps) can be calculated as follows:
Rps = Dps/Pnet
where:
Dps = preferred dividends
Pnet = net issuing price

Example: Cost of Preferred Stock
Assume Newco's preferred stock pays a dividend of $2 per share and sells for $100 per share. If the cost to Newco to issue new shares is 4%, what is Newco's cost of preferred stock?


Answer:
Rps = Dps/Pnet = $2/$100(1-0.04) = 2.1%


Next, we'll take a look at the weighted average cost of capital, a calculation that will put our formulas for both the cost of equity and the cost of debt to work.

Weighted average cost of capital (WACC) is a calculation of a firm's cost of capital in which each category of capital is proportionately weighted. All capital sources - common stock, preferred stock, bonds and any other long-term debt - are included in a WACC calculation. All else equal, the WACC of a firm increases as the beta and rate of return on equity increases, as an increase in WACC notes a decrease in valuation and a higher risk.

The WACC equation is the cost of each capital component multiplied by its proportional weight and then summed:


Where:
Re = cost of equity
Rd = cost of debt
E = market value of the firm's equity
D = market value of the firm's debt
V = E + D
E/V = percentage of financing that is equity
D/V = percentage of financing that is debt
Tc = corporate tax rate


Broadly speaking, a company's assets are financed by either debt or equity. WACC is the average of the costs of these sources of financing, each of which is weighted by its respective use in the given situation. By taking a weighted average, we can see how much interest the company has to pay for every dollar it finances.

A firm's WACC is the overall required return on the firm as a whole and, as such, it is often used internally by company directors to determine the economic feasibility of expansionary opportunities and mergers. It is the appropriate discount rate to use for cash flows with risk that is similar to that of the overall firm. (Learn more in Evaluating A Company's Capital Structure.)


Further Understanding WACC

The capital funding of a company is made up of two components: debt and equity. Lenders and equity holders each expect a certain return on the funds or capital they have provided. The cost of capital is the expected return to equity owners (or shareholders) and to debtholders, so WACC tells us the return that both stakeholders - equity owners and lenders - can expect. WACC, in other words, represents the investor's opportunity cost of taking on the risk of putting money into a company.


To understand WACC, think of a company as a bag of money. The money in the bag comes from two sources: debt and equity. Money from business operations is not a third source because, after paying for debt, any cash left over that is not returned to shareholders in the form of dividends is kept in the bag on behalf of shareholders. If debt holders require a 10% return on their investment and shareholders require a 20% return, then, on average, projects funded by the bag of money will have to return 15% to satisfy debt and equity holders. The 15% is the WACC.

If the only money the bag held was $50 from debtholders and $50 from shareholders, and the company invested $100 in a project, to meet expectations the project would have to return $5 a year to debtholders and $10 a year to shareholders. This would require a total return of $15 a year, or a 15% WACC.


WACC: An Investment Tool

Securities analysts employ WACC all the time when valuing and selecting investments. In discounted cash flow analysis, for instance, WACC is used as the discount rate applied to future cash flows for deriving a business's net present value. WACC can be used as a hurdle rate against which to assess ROIC performance. It also plays a key role in economic value added (EVA) calculations.


Investors use WACC as a tool to decide whether to invest. The WACC represents the minimum rate of return at which a company produces value for its investors. Let's say a company produces a return of 20% and has a WACC of 11%. That means that for every dollar the company invests into capital, the company is creating nine cents of value. By contrast, if the company's return is less than WACC, the company is shedding value, which indicates that investors should put their money elsewhere.
WACC serves as a useful reality check for investors. To be blunt, the average investor probably wouldn't go to the trouble of calculating WACC because it is a complicated measure that requires a lot of detailed company information. Nonetheless, it helps investors to know the meaning of WACC when they see it in brokerage analysts' reports.

Be warned: the WACC formula seems easier to calculate than it really is. Just as two people will hardly ever interpret a piece of art the same way, rarely will two people derive the same WACC. And even if two people do reach the same WACC, all the other applied judgments and valuation methods will likely ensure that each has a different opinion regarding the components that comprise the company's value.


BUACC3701 - Shareholder Value and Cost of Equity

First of all, I will focus on the shareholder value topic before I proceed to the cost of equity topic.

What shareholder value is really about?


This blog post is part of the HBR Online Forum The CEO’s Role in Fixing the System.

Most CEOs, as well as some of the other contributors to this forum, appear to have a false sense of what creating shareholder value means. CEOs need to understand the principles of shareholder value and why they are so important in judging difficult trade-offs, learn about the relationship between the financial performance of the company and the company’s stock, and communicate clearly and act appropriately when expectations gaps open.

It is now in vogue to dismiss the idea that creating shareholder value should be a CEO’s guiding objective. Concepts like “societal value,” “shared value,” and “customer capitalism” are offered as desirable and more enlightened substitutes. This is muddled thinking. CEOs who understand the principles of shareholder value and execute effectively will satisfy most, if not all, of the objectives of those who call for a new way of thinking. The problem is that the true definition of creating shareholder value seems to have gotten lost.

A CEO must understand three issues to be effective. First, he or she needs to internalize the true meaning of creating shareholder value. This amounts to a collection of principles that guide strategic, financial, and organizational issues. Second, he or she needs to understand how capital markets work. Finally, he or she must communicate effectively to shareholders, as well as to other stakeholders.

Creating Shareholder Value

Critics imply that managing for shareholder value is all about maximizing the short-term stock price. Companies that manage for shareholder value, the thinking goes, do whatever it takes to engineer an ever-higher market price. That is a profound misunderstanding. The premise of shareholder value, properly understood, is that if a company builds value, the stock price will eventually follow. The objective is to build value and then let the price reflect that value.

While some executives allow that they should not manage to increase the short-term stock price, they remain reluctant to embrace the concept of managing for shareholder value. It is worth explaining why this is the right objective, and how other stakeholders — including employees, customers, and suppliers — fit into the picture.

A CEO’s job is about resource allocation with a goal of earning a return in excess of the opportunity cost of capital. This requires difficult trade-offs. The challenge is figuring out how to allocate human and financial capital to its best and highest use for the long term. Value creation, by means of maximizing long-term free cash flow, provides the appropriate approach to judge alternative strategies and subsequent performance.

Here’s where other stakeholders come in. To maximize long-term free cash flow, a company must properly manage its relationships with all of its stakeholders. For instance, companies that charge too much for their goods or services will lose customers to the competition. Companies that charge too little may have happy customers but will be unable to meet their other financial obligations or offer new and improved products and services to customers. So a successful shareholder value-oriented company must find the price that adds value for both customers and shareholders.

Similarly, paying employees too little ensures a substandard workforce in a competitive world. Paying employees too much, as the U.S. auto companies discovered, hampers a company’s ability to remain competitive. The same logic extends to suppliers and the government.

The shareholder value approach acknowledges the tough choices that corporate executives face, and gives them a means to decide between them. But one point should be abundantly clear: A company cannot maximize shareholder value through systematic exploitation of its stakeholders.

Understanding Capital Markets

Almost without fail, individuals who get promoted to the position of CEO have been highly successful in some part of the corporation. They may have effectively run a large division or devised a winning marketing strategy. But the fact is, most CEOs have a poor understanding of how the stock market works. The skills and effort that catapulted them to the top spot typically do not prepare them to deal with markets and investors.
An enlightened CEO learns how the stock market sets prices. The research in this area points to three salient points:

First, the value of the business is the present value of future cash flows. In the very long haul, earnings and cash flow converge. But in the short run, cash flows and earnings can be very different. Notwithstanding a nearly ubiquitous focus on earnings and earnings per share, the informed CEO will focus on long-term cash flow.

Second, the stock market reflects cash flows many years into the future — it is long-term oriented. Let me say that again: No matter what you hear about short-term focused investors, values in the stock market are driven by long-term cash flows. Essentially, investors make short-term bets on long-term outcomes. The way to convince yourself of this is to build a spreadsheet and see for yourself. It is not uncommon for it to take 10 or more years of value-creating cash flows to justify a company’s stock price.


Third, the market pays for value creation. Take M&A as an example. Most deals are additive to earnings but destroy value. But research shows that if the synergies of combining businesses exceed the premium the acquirer pays, the stock of the acquiring company goes up irrespective of the immediate earnings impact — and the reverse is true as well.

CEOs often pay attention to analysts, investment bankers, or the media to try to understand the market. None of these are good sources because they represent a small percentage of the collective information that prices capture. A CEO who doesn’t take the time to understand markets is at risk of being influenced by individuals who have incentives that are not aligned with the goals of the company.

Communication

A company’s stock price conveys useful information about the expectations for future financial performance. Executives can reverse engineer those expectations, generally expressed through value drivers, and compare them to the company’s internal forecasts. (Value drivers include sales growth, operating profit margin, and investment requirements.) Large gaps between what the market believes and what the company believes represent an opportunity for communication or action.

If a company perceives that the market has the expectations wrong, the CEO can discuss the key value drivers of the business with the financial community in order to narrow the gap. If the market doesn’t respond, management can take action to benefit from the value gap. For example, if the shares are undervalued, management can buy back shares. If the shares are overvalued, management can issue them as currency for an acquisition.

There is no reason to scrap the notion of creating shareholder value. If anything, it is more important now than ever. The problem is that the concept is broadly misunderstood. CEOs need to grasp what creating shareholder value is really about and to have the fortitude to implement strategies to create long-term value.

Michael Mauboussin is an investment strategist and an adjunct professor at Columbia Business School. His latest book is The Success Equation.


And..... this is a debate. Something to look on. Watch and I need your views on this.
